
Planda updates - Dec. 26
New feature: Activity Graph for hours spent on events
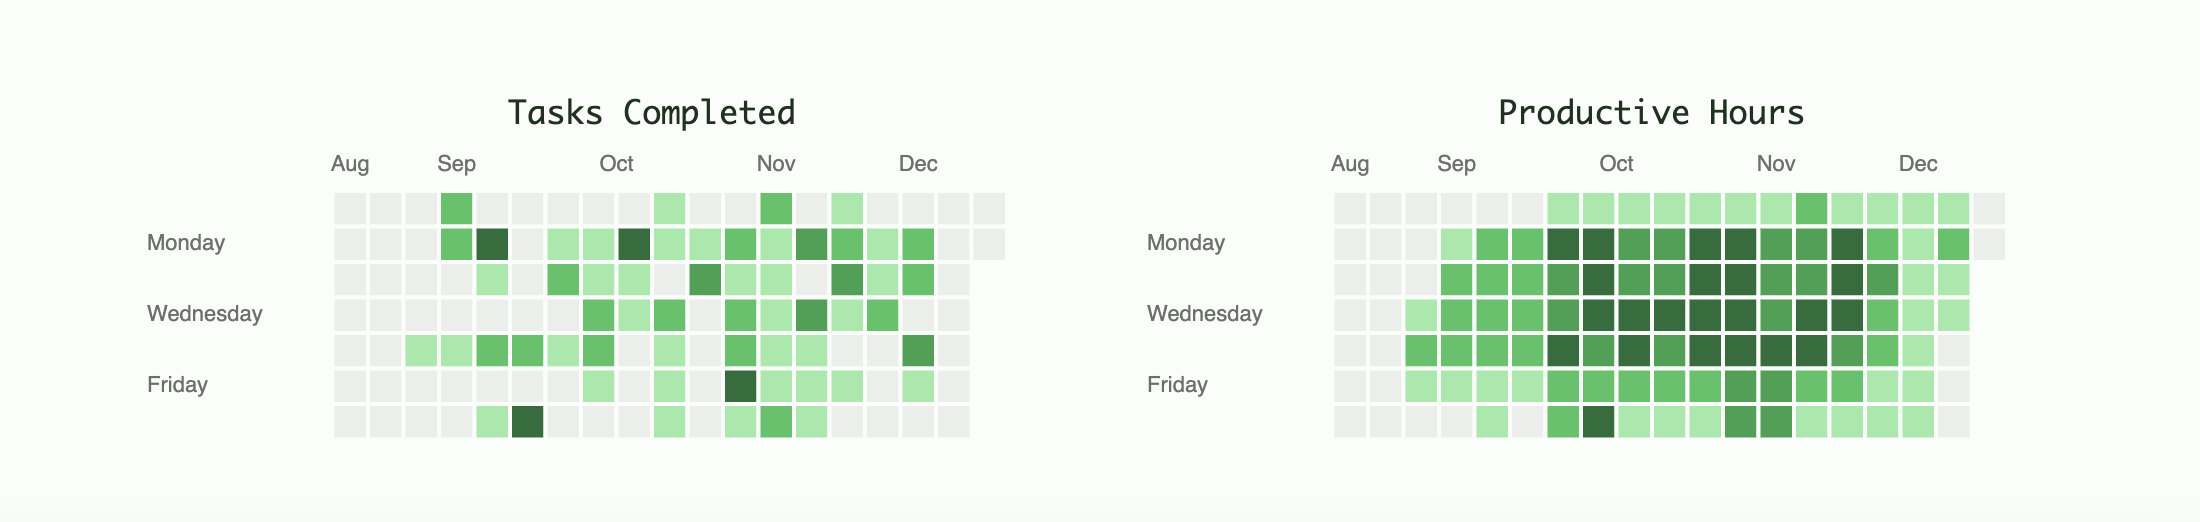
There are now two graphs on the homepage describing user productivity. These go up to 4 months long, since that encapsulates the entire semester.
Productive Hours currently counts the number of hours per day of non-empty space on the time-grid calendar (ex. week/time).
Tasks Completed counts the number of check marks ticked off. This includes both tasks and their subtasks.
Other
- Fix about page for mobile
- Make homepage more responsive
Next steps
Productive Hours currently counts all non-empty hours, but recreational events, like sleep or eat lunch, should be excluded. One idea is to add another attribute isRestful to all items, with default to false | undefined. This way these items can be filtered out from this count before hand. Users would have the option to choose whether a task is restful or productive.